
If you spend your day inside Odoo — whether writing modules, debugging client issues, or navigating Odoo.SH — there are a handful of browser extensions that change how you work. Not in the “nice to have” way, but in the “I don’t know how I worked without this” way.
This post covers three of them.
1. Odoo Terminal
GitHub: Tardo/OdooTerminal · Chrome Web Store
Odoo Terminal gives you a command-line interface inside the browser to interact with any Odoo instance via JSON-RPC. Think of it as a REPL for Odoo’s ORM — without opening the shell, without SSH, without leaving the page you’re on.

What you can do
Search records by condition:
search -m res.partner -d [['is_company','=',true]]
Read a specific record by ID:
read -m res.partner -i [1]
Update record values:
write -m res.partner -i [42] -v {name: 'Trobz Vietnam'}
Call any model method:
call -m res.partner -c address_get -a [8]
Install a module:
install -m contacts
Custom aliases — define shortcuts for commands you run repeatedly:
alias -n companies -c "search -m res.partner -d [['is_company','=',true]]"
Then just type companies anytime. Aliases persist across page reloads and support arguments, conditionals, and nested commands.
These are just the basics; there are many more commands waiting for you. Explore them using:
help
Why it’s useful
The most practical use case is debugging access rights and data issues during development or support. Instead of writing a python_external_id() snippet or opening a Jupyter notebook, you run a search command, inspect the result, and call the relevant method — all without context-switching.
It supports Odoo 11 through 19, and it never patches Odoo’s internal classes, so it’s safe to use on any environment including production (read-only commands) or staging.
2. Odoo Toolbox
GitHub: odoo-lux-dev/odoo-toolbox · Docs · Chrome Web Store
Odoo Toolbox is a DevTools extension aimed at developers and Odoo.SH users. It surfaces technical context that Odoo hides by default and adds a proper RPC testing panel directly inside the browser DevTools.
What you can do
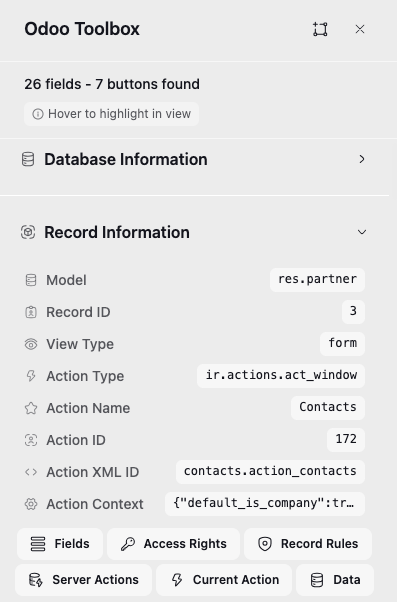
Developer sidebar — when browsing a record, a collapsible panel shows the technical model name, current record ID, active fields, and database context. No more guessing which model a view maps to.
Imagine you’re on a customer form. The sidebar shows:
Model:    res.partner
Record:    42
View Type:    form
Action Name:    Contacts
Action ID:    172
It then lists the fields (name, data type) of the current model below.
You need the model name to write a domain filter, or the record ID to craft a quick write command. It’s all there without opening the URL or digging through Settings → Technical.
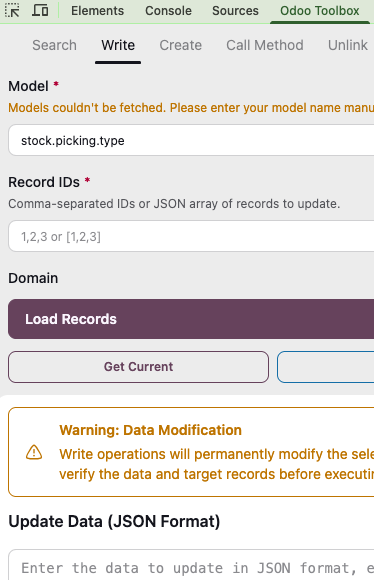
RPC testing panel — open DevTools (F12) → go to the Odoo Toolbox tab. You can fire a JSON-RPC call directly:
Model:   sale.order
Record IDs:  [1, 2, 3]
Fields:    ['email', 'display_name']
Domain:    ['field', '=', 'value']
Hit Execute Query. The response appears formatted in the panel. No Postman, no curl, no leaving the browser.
Debug mode toggle — click the extension icon → toggle Debug Mode on/off with one click. You can also set it to auto-enable whenever you visit any Odoo URL, so you never have to add ?debug=1 manually again.
Model name on records — shows the technical model name directly on the form header (Odoo v17.2+), which is handy when navigating unfamiliar views or a client’s custom modules. For example, when you open a custom menu item that leads to an unknown form, instead of hovering over the URL or going to Settings to figure out what you’re looking at, the model name x_custom_approval.request is printed right on the page title area.
Odoo.SH helpers — if you work with Odoo.SH daily, these small additions reduce constant clicking:
- Star projects as favorites so they appear at the top of your SH dashboard
- Copy the current branch name with one click (useful when naming a PR or writing a commit)
- Link branches to custom URLs with regex patterns — e.g. auto-link to your Jira ticket
- Jump to the GitHub repository directly from a branch page
Why it’s useful
Odoo Toolbox solves a daily friction: you’re on a record and you don’t know the model name, the record ID, or which fields exist. Normally that means opening the URL, reading model= from the hash, or going to Settings → Technical. With the sidebar visible, that information is always one glance away.
For Odoo.SH users specifically, the branch management features alone justify installing it — starring projects and copying branch names removes several clicks from the typical SH workflow.
3. Owl Devtools
GitHub: odoo/owl · Chrome Web Store
Since Odoo 15, the frontend is built on OWL — Odoo’s own JavaScript component framework. If you’re doing any frontend work in Odoo, Owl Devtools is the equivalent of React DevTools or Vue Devtools. It’s maintained by the Odoo team themselves.

What you can do
Once installed, an Owl tab appears in your browser DevTools (F12 → Owl).
Component tree inspection — the left panel shows all Owl components currently rendered on the page as a tree. For example, on a sale order form you might see:
▼ WebClient
  ▼ ActionContainer
    ▼ FormView
      ▼ FormRenderer
        ▼ Field (name="partner_id")
          └─ Many2OneField
        ▼ Field (name="order_line")
          └─ One2ManyField
              ▼ ListRenderer
                └─ SaleOrderLine  ← click this
Click any node and the right panel immediately shows its current props, state, and env — no console.log, no page reload.
Concrete debugging scenario — say a custom widget isn’t updating when you expect it to. Open the Owl tab, find the component in the tree, and check its state. If the state already has the new value but the UI hasn’t updated, the issue is in the template. If the state is still old, the issue is in how the state is being mutated (a common mistake: mutating a reactive object’s nested property directly instead of reassigning it).
Render tracing — tick “Trace Renderings” in the Owl tab, then interact with the page. Every render event is logged to the console with a traceback:
[OWL] Rendering <SaleOrderLine> (id=12)
  triggered by: state.qty_delivered changed
  at SaleOrderLine.setup (sale_order_line.js:34)
This tells you exactly which state change caused a re-render — or why a component is re-rendering too many times.
Performance profiler — click Start, interact with the page, click Stop. The profiler shows a Gantt-style timeline of every component render: which components ran, in what order, and how long each took. If a list view feels sluggish, this is how you find which component is the bottleneck.
iframe support — Odoo POS runs its frontend inside an iframe. Without this, opening DevTools on the POS page shows you the parent page’s component tree, not the POS components. The extension detects Owl-powered iframes automatically and adds a dropdown selector at the top of the Owl panel so you can switch between the main app and the POS iframe — letting you inspect ProductCard, PaymentScreen, or any other POS component the same way you would any other Owl component.
Why it’s useful
Debugging OWL components without this extension means relying on console.log inside lifecycle hooks and guessing at what triggered a re-render. With Owl Devtools, you can see the entire component tree live, inspect state changes in real time, and profile renders to find performance bottlenecks — the same workflow that frontend developers take for granted in React or Vue land.
It’s particularly valuable when working with customized views, custom OWL components, or debugging why a widget isn’t updating after a state change.
Summary
| Extension | Best for |
|---|---|
| Odoo Terminal | Running ORM queries, calling methods, scripting data ops — all from the browser |
| Odoo Toolbox | Surfacing technical context, RPC testing, Odoo.SH project management |
| Owl Devtools | Inspecting OWL component tree, debugging state/props, profiling renders |
All three are free, open source, and available on the Chrome Web Store. Install them once and they become invisible infrastructure — always available when you need them, zero overhead when you don’t.