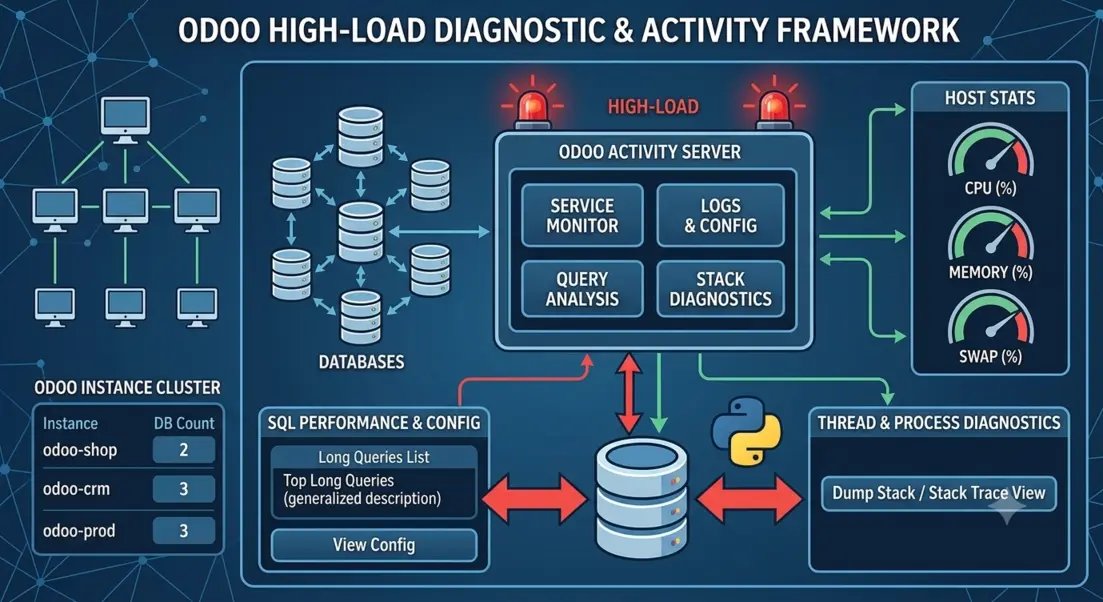
For years pg_activity has answered one question well: what is postgres
doing right now. Open it, and the queries are there, longest-running first.
There is no equivalent for Odoo. When an instance is pegged and someone asks what it is busy with, you fall back on improvisation:
pstells you a worker has been alive for six days. It says nothing about the request it has been stuck in for the last forty seconds.kill -3 <pid>makes Odoo print the stacks of all its threads into the log. Then you go digging through the log to find them, per worker, and if the worker is blocked in postgres or on IO the traceback is accurate and useless.py-spy dumpgives better output, but it needs root on a machine where you probably only have theodoouser.- Patching Odoo to write the current call into the process title with
setproctitle, which we did try a long time ago. It reads well inps, at the cost of a core patch to maintain per project.
Each of these answers a slice of the question, through a different tool, with output in a different shape. Correlating them is manual work done under time pressure, which is exactly when a diagnostic step gets skipped.
odoo-activity (oa) is our attempt at the missing screen.
One screen
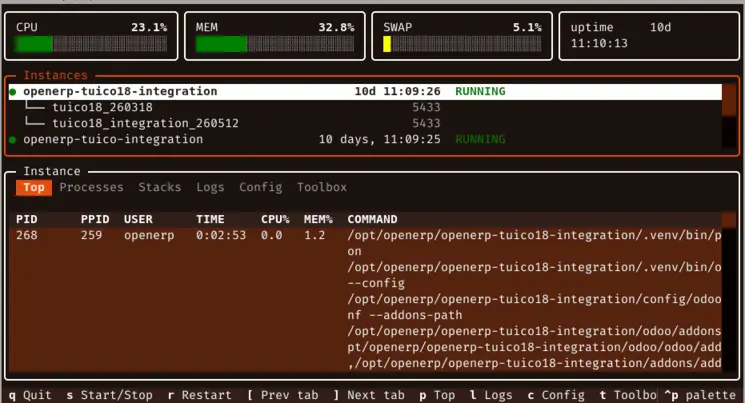
Host CPU, memory, swap and load in the header. The second pane shows every Odoo instance on the box, with its databases nested underneath. The third pane is a detail view whose tabs change with what is highlighted:
| Highlighted | Tabs |
|---|---|
| an instance | Top, Processes, Stacks, Logs, Config |
| one of its databases | Queries, Users, Locks, Jobs, Crons, Modules |
The tab set is not settled and will move as we use the tool; the rule we hold to is that whatever earns a tab has to be worth reading during a diagnostic, not merely available.
Instances are discovered, not configured: systemd --user units,
supervisor programs, odoo.sh builds, and local instances run directly from
a terminal, merged into one list. From there
everything about an instance resolves from a single file, its config under
<workdir>/config/: odoo.conf or server.conf, and odooNN.conf for a
node of a multi-node instance, whose name carries the matching -NN suffix
(foo-01). That is where the databases come from, the logfile, the db port,
the whole lot.
Remote hosts work the same way:
oa                       # this machine
oa odoo@somehost         # over ssh
oa odoo@somehost -p 10113
The ssh connection is multiplexed, so the first probe opens the session and
everything after reuses it. Refresh runs on a slower tick against a remote
host, and R forces the active tab immediately.
Odoo and postgres in the same table
The Top tab lists the instance’s workers (walked down the PPID tree from the master PID the manager reports) and, in the same table, the postgres backends serving that instance’s databases.
That pairing is the part we use most. A backend that is chewing has its
client TCP port in its ps title; lsof on that port gives back the PID on
the other end, which is the Odoo worker that opened it. “Which query is
slow” and “which worker is stuck” stop being two separate investigations.
When an instance is on fire
A rough order of operations, from cheapest to most invasive:
-
Read the header first. Swap climbing and load high means memory, not code, and no amount of stack dumping will tell you that.
-
Top (
p). How many workers, how much memory each, and how many postgres backends they are holding open. A single worker at high memory is a different problem from all of them being busy. -
Dump stacks (
D). SIGQUIT to the master and every worker, then read the fresh stack dumps back out of the log and parse them. Roughly two seconds. Workers come back sorted busy-first, threads busy-before-idle, and each traceback is reversed so the innermost frame (the line actually running) is the first thing you read, py-spy style.This is the
kill -3trick, minus the log archaeology. SIGQUIT here does not kill anything: Odoo installs a handler for it that only prints stacks. -
Frames point into postgres? Move down to the database row and go to the Queries tab with
[/]. Non-idle queries frompg_stat_activity, longest-running first. -
Stuck rather than slow? Locks (
l) on the database. Waiting on a cron or a queue job? Crons (c) and Jobs (j), same place. -
Then act.
Kkills the one bad worker with-9.Lsends-3and jumps you to the Logs tab if you want the traceback recorded before you kill it.rrestarts the whole instance,stoggles start/stop. All of them behind a confirm popup.
Steps 1 to 5 change nothing on the target host. That matters when the host in question is production and you are three minutes into an incident.
The same data, for an agent
Everything above is exposed as an MCP server:
oa-mcp odoo@somehost
The tools are read-only, deliberately: list_instances, host_stats,
instance_top, instance_databases, instance_version, instance_config,
instance_log_tail, instance_dump_stacks, long_queries, and db_query for
a scoped subset of odoo-db’s diagnostic commands (modules, crons, jobs, users,
locks). No start, no stop, no restart, no kill.
oa-mcp is pinned to one host, the same way oa <host> is. A tool call
that names a different host is rejected rather than silently retargeted.
oa-mcp-multi leaves the target per-call instead, capped by a --host-filter
regex and a --host-file of ssh aliases.
The intended shape is two people on one incident, where one of them is an
agent: you on oa somehost, it on oa-mcp somehost, both looking at the
same instance. You ask why the thing is slow, it dumps stacks and reads
pg_stat_activity, and you are already staring at the same table it is
describing.
Action tools will be run by you, not the agent. Starting read-only targets the real bottleneck: diagnosis
What it needs
- The instance managed by
systemd --user,supervisor, running on odoo.sh, or run locally, directly from a terminal. odoo-dbonPATHfor the database tabs,odoo-configandodoo-addons-pathfor the Config tab.psqlfor database discovery and the Queries tab,lsoffor the backend-to-worker link.- For a remote target: those same tools on the remote host, not on yours.
uv tool install odoo-activity